CO2e emissions from production
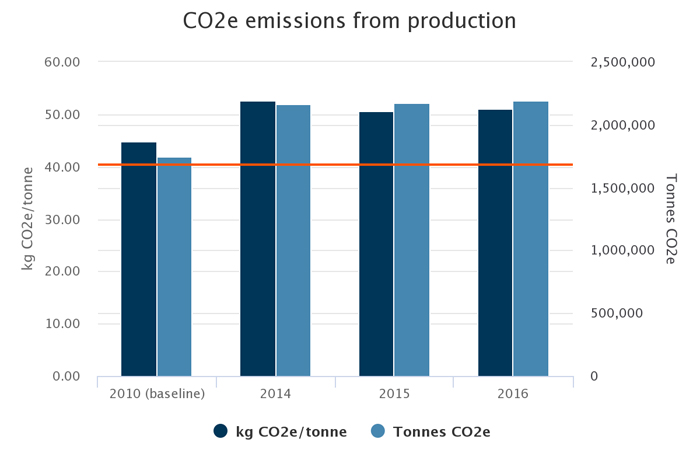
Emissions of CO2e per tonne of product were broadly flat, but there were notable variances across the product lines. Concrete, aggregates and asphalt all fell on a per tonne of product basis, concrete by nearly 12 per cent, but there was a six per cent rise in cement where the bulk of our CO2e emissions arise. This resulted mainly from a drop in the alternative fuels used (see the section on waste as fuel) to heat the limestone and shale mix to produce clinker, which resulted in more coal being burned.

-
CO2e emissions from production
CO2e emissions from production
2010 (baseline)
2014
2015
2016
% change since 2010
% change since 2015
Kilogrammes of CO2e per tonne of product
44.80
52.60
50.65
51.01
13.9%
0.7%
Tonnes of CO2e from production
1,751,295
2,166,944
2,171,619 2,194,227 25%
1.0%
Click here for data by business line
Data corrections for 2014 and 2015 due to improvements in reporting integrity.
Note: All data is scope 1 and 2 emissions using published DEFRA or EUETS 2016 emissions factors.
When normalised against production changes at business line level, the 2016 performance is 43.92 kg CO2e/tonne against a 2010 baseline of 43.19kg CO2e/tonne, showing an increase of 1.7%.


