CO2e emissions from transport
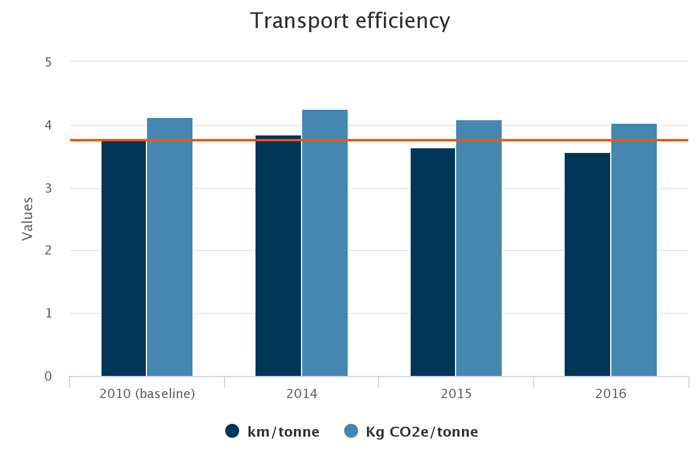
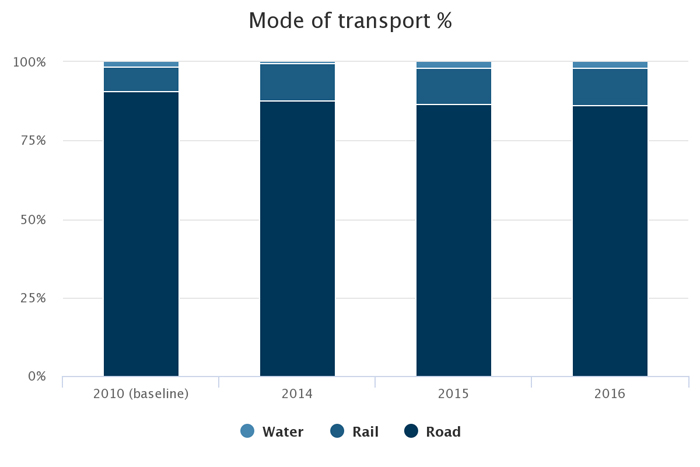
CO2e emissions from transport on a per tonne basis fell slightly during the year. There was an increase in the cement business line due to some operating difficulties that required material to be transported further but this was offset by better vehicle scheduling in asphalt, aggregates and concrete. We now have a higher percentage of our own vehicles meaning we can track fuel use more accurately and provide fuel efficiency training for all our drivers. Rail deliveries increased slightly for aggregates but cement was static.
A project to optimise order handling and vehicle scheduling in the aggregates, asphalt and concrete business lines is ongoing. The aim is to improve vehicle use and reduce fuel costs. The project is focused on the effective and efficient use of our delivery fleet through the introduction of vehicle optimisation software, GPS and a material resource planner (MRP) to schedule internal deliveries.

-
CO2e emissions from transport
Transport efficiency
2010 (baseline)
2014
2015
2016
Tonnes delivered
29,529,302
27,212,523
28,473,246
30,027,466
kg CO2e / tonne
4.12
4.25
4.09
4.03
Total distance travelled km
111,580,638
104,436,393
103,660,621
107,116,583
Tonnes CO2e / year
121,589
115,618
116,435
120,878
Click here for data by business line
Cement transport factor for water amended from 2014 to align with DEFRA GHG factors.
Error in the 2010 Rail transport mileage has been rectified.

-
Mode of transport
Mode of transport
2010 (baseline)
2014
2015
2016
Road
90.78
87.75
86.55 86.13 Rail
7.91
11.76
11.45 11.89 Water
1.31
0.50
2.00
1.98


