Health, safety and well being
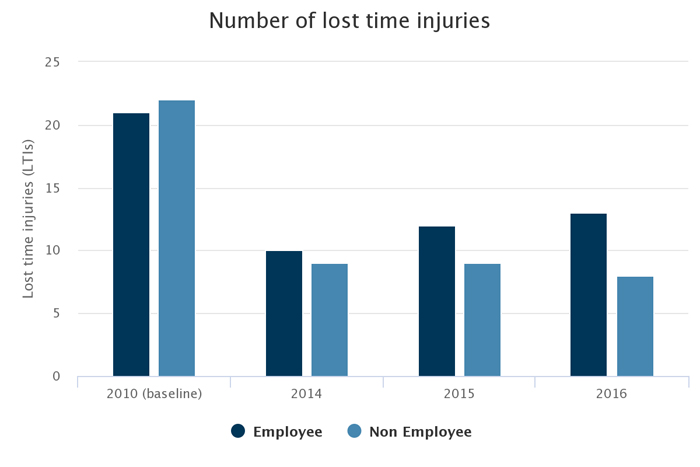
Our safety performance in 2016 was disappointing. The total number of lost time injuries (LTIs) remained static at 21 and the employee LTI frequency rate of injuries per one million hours worked, which has been adopted as a standard industry indicator, rose from 1.74 to 1.84. The employee LTI severity rate, derived from the total number of days lost, fell from 77.3 to 50.3, demonstrating that many of the incidents resulted in only minor injuries.
We engage with our work force through safety conversations and encouraging near-hit reporting, both of which increased during the year, along with regular tool box talks and best practise alerts. We also have regular one-to-one safety discussions with all employees along with comprehensive health and safety training from both in-house specialists and external consultants delivered through monthly conference calls, podcasts and on-site discussions and supported by our network of sustainability reps. We continue to deliver the Mineral Products Association’s ‘Safer by Competence’ programme.
Employee well-being and creating a healthy work environment are important to us and we again provided occupational health check-ups and well being ‘MoTs’ for our employees to detect existing or underlying issues. We also extended our health and safety information and advice to embrace home life and families through a dedicated website www.safeandhealthyathome.co.uk.
Our round-the-clock telephone counselling service EmployeeCare provides confidential support on a broad range of work-related and personal issues from financial management and relationships to health, drugs and bereavement.
We continued with our programme of random and unannounced drugs and alcohol testing at operational sites and offices. The testing is combined with an awareness campaign to explain the impact and effects of different types of drugs and encourage employees who think they may be at risk to seek help and support.

-
Lost time injuries data
Lost time injuries
2010 (baseline)
2014
2015
2016
Employees
21
10
12
13
Contractors
22
9
9
8
Employee severity rate
44.2
41.0
77.3
50.3
Employee frequency rate
2.66
1.47
1.74
1.84

